Visualize LV Mass Scaling Methods
Interactive tools to explore how different body size scaling methods affect left ventricular hypertrophy (LVH) diagnosis across patient populations.
Why LV Mass Scaling Matters
Different approaches to body size normalization can lead to different clinical conclusions about the same patient. The choice of scaling method can significantly affect the diagnosis of LVH.
How to Use This Tool
Select Methods
Choose which scaling approaches (BSA, height-based, lean body mass, etc.) and reference values to use for comparison. Choose from a curated list or explore on your own
Tailor Patient Data
Adjust for patient demographics & anthropometrics.Experiment with different BMI values to see how body composition affects each method.
Explore Across Populations
Compare how different methods perform across diverse patient types. Watch how thresholds shift with changing patient characteristics.
Gain Clinical Insights
Understand the clinical implications of each scaling approach. When might traditional BSA indexing under- or over-diagnose LVH?
Explore the Tools
LV Mass Scaling
Compare BSA, height-based, and lean body mass approaches for LV mass indexing.
Explore Tool →Wall Thickness
Explore dimensional analysis approaches to LV posterior wall thickness indexing and scaling.
Explore Tool →References
Browse the scientific literature and reference studies behind each scaling method.
View References →About
Learn about the motivation, methodology, and scientific background behind this project.
Learn More →Interactive LV Mass Scaling Tool
LV Mass Scaling Method Comparison
Some references provide population-specific thresholds
BSA (m²) = 0.007184 × height(cm)^0.725 × weight(kg)^0.425
Select a preset to quickly compare different LV mass scaling methods. Each preset demonstrates key methodological concepts and clinical considerations.
Essential Comparison
BSA Methods
Body Composition
Height Methods
Guidelines
Special Populations
💡 Tip: You can collapse this panel once you start building custom comparisons below.
Method Comparison Builder
0LV MassActive Methods (0/4)
No methods selected
Choose a preset above or add a custom method
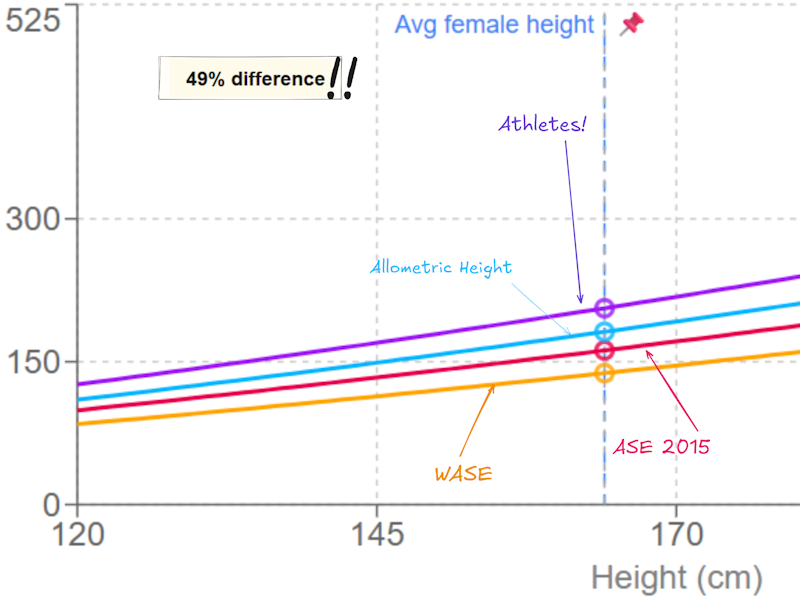
Absolute LV Mass Thresholds (g) by Selected Methods
Add series to visualize data
Hover over the chart to see detailed data point information
Click on a point to keep it pinned